
Alistair Croll was not referring to the historic uprooting of Asheville’s Southside neighborhood when he said, “Data doesn’t invade people’s lives. Lack of control over how it’s used does.”
But he could have been.
We treat “big data” as a 21st century phenomenon that Google or Facebook brought upon us, as though data are only now being mined for ends we have yet to imagine. For the residents of Asheville’s Southside, though, there is no need for imagination. They have already experienced that lack of control.
Twilight of a Neighborhood was a public humanities project that focused on Asheville’s African American neighborhoods, which included East End, Burton Street, Stump Town, and Southside. The Southside was one of an estimated 1,600 African American neighborhoods that were torn apart over three decades of continuous “urban renewal” between the 1950s and 1970s.
The result of that renewal, says Dr. Mindy Fullilove, an urban scholar and psychiatrist at Columbia University, is root shock, “ the traumatic stress reaction to the loss of some or all of one’s emotional ecosystem.” Robert Hardy of the Southside Neighborhood Association spoke of the impact of root shock on his community, “The resulting 'fiasco' which we are now living is perpetual poverty for the descendants and gentrification of their land.”
Priscillia Ndiaye, born and raised in the Southside neighborhood and a Chair of the Southside Community Advisory Board, (and a collaborator on the CI-BER project) reflects on what happened to her neighborhood, “Multiple perspectives, lack of knowledge, much confusion, and discouraged and bitter individuals are all entwined as spiders in a web: any way you touch it, it trembles.”
“At over four hundred acres, the urban renewal project here was the largest in the southeastern United States. The scale of the devastation here was unmatched.” Over a thousand homes were bulldozed, as well as churches, gas stations, grocery stores, funeral homes, businesses, schools, doctor offices, and a hospital.
How were these neighborhoods targeted? One answer lies in an earlier type of “big data.” As far back as the 1930s, the U.S. Census Survey has been collecting data from citizens who had little knowledge or control over how it was used. Alistair Croll is correct when he says that “Big data is our generation’s civil rights issue and we don’t know it,” except that for many African Americans, the link between big data and civil rights issues is nothing new.
Richard Marciano and Chien-Yi Hou extended an approach taken from an earlier project called T-RACES (mapping redlining in California cities) and applied it to cities in North Carolina including the city of Asheville. Advisors on the Asheville redlining project included Priscilla Ndiaye, chair of Asheville's Southside Advisory Committee, and Dwight Mullen, UNCA Political Science professor. Richard writes that, “Urban renewal as a federal government program was a 24-year (1949-1973) initiative started under the Housing Act of 1949, and was modified under the Housing Act of 1954. It used the 1930’s Home Owners’ Loan Corporation (HOLC) redlining terminology of “blight” and “slums” to launch an ambitious redevelopment and eminent domain process that led to the bulldozing of 2,500 neighborhoods in 993 American cities.”
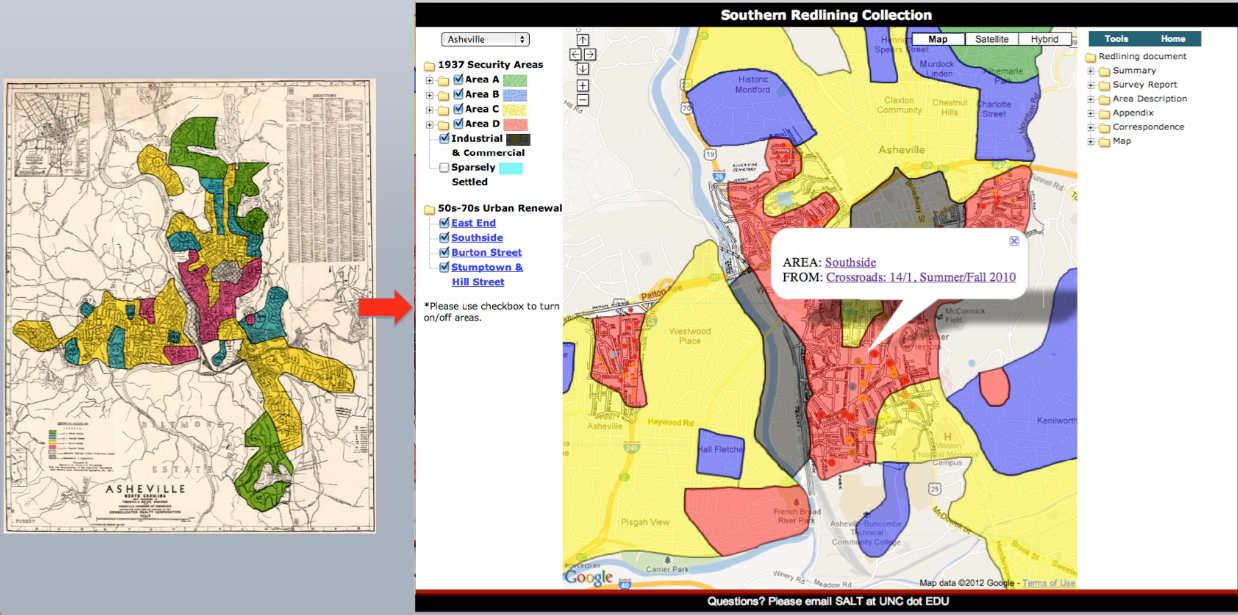
Referring to the image above, Richard continues, “There is a picture of the 1937 Asheville redlining map and on the right is a snapshot of an interactive web mapping application that allows exploration of redlining but also superimposes the four major urban renewal neighborhoods of Asheville impacted in the 60s, 70s, and beyond, including the Southside neighborhood.”
“What is remarkable about these preliminary findings (we believe this to be one of the first interactive juxtapositions of these sets of historical policies) is the fact that the urban renewal footprint is almost a perfect match with the earlier 1937 redlining disinvestment one. The legacy of redlining, urban renewal, and the social philosophy that authorized it as an economic and policy instrument is still evident in the range of problems that continue to impact many urban neighborhoods.”
This is where the CI-BER project gets involved. We have chosen to set our initial study in the context of the heterogeneous datasets and multi-source historical and digital collections of the City of Asheville in North Carolina.
This allows us to start small, to validate core concepts of the research, and subsequently scale nationally. We are assembling historical and born-digital collections that span 100 years of urban development and include heterogeneous records of 1930s New Deal policies, of 1960s Urban Renewal policies, and 1990s planning documents.
Nationwide, thousands of cities followed the same development patterns, and the case study naturally leads to scaling at a very large national level. By focusing on this particular place, we will demonstrate the potential for automation and integration of temporal and spatial datasets involving census, economic, historic, planning, insurance, scientific, and financial content, with an eye on scalability and the goal of making a national impact on future research.
Richard has already conducted surveys and a pilot of the types of data sources involved from scanned imagery, maps, digitized datasets, National Archives federal records, and beyond, many of which are already part of the CI-BER testbed. Workflows demonstrating the potential for automation and integration at scale will be researched and citizen-scientist crowdsourcing processes deployed.
We have already secured the support of a number of entities in Asheville, including citizen groups, non-profits, city organizations, and universities. In upcoming posts, we will look at other facts of the CI-BER collaboration.
Please join us on our Collaborative Data group at HASTAC.org to network with others working in this research area, and to receive updates on other collaborative data projects.
Flickr image courtesy of LaurenManning
No comments:
Post a Comment